
How to Trade Triangle Chart Patterns
Learn how to identify and trade Triangle Chart Patterns in crypto trading. Explore breakout strategies, continuation tactics, and tips to avoid false breakouts.
10/26/20242 min read
How to Trade Triangle Chart Patterns
Disclosure: This article is for educational purposes only and does not constitute investment advice.
Technical analysis is a crucial part of trading, helping traders understand market trends and make informed decisions. One of the most useful patterns for identifying potential breakouts is the Triangle Chart Pattern, which signals a period of consolidation before a potential price spike.
📈 Trade Smarter with These Offers!
❎ BITFLEX: Double your first deposit up to 100%! Get a bonus of up to $2,000 with this referral link: https://bit.ly/4d0k9i3.
🟧 BYBIT: New users depositing over $100 can earn up to 6,045 USDT in signup bonuses. Start trading here: https://bit.ly/3MgHQaZ.
Make the most of these bonuses and boost your trading! 🚀
What is a Triangle Chart Pattern?
A triangle chart pattern forms as the price narrows within converging trendlines, indicating decreasing volatility. It’s typically seen as a consolidation pattern that emerges after strong price movement in a particular direction. The pattern suggests the possibility of a breakout, often in the same direction as the prior trend.
Types of Triangle Patterns
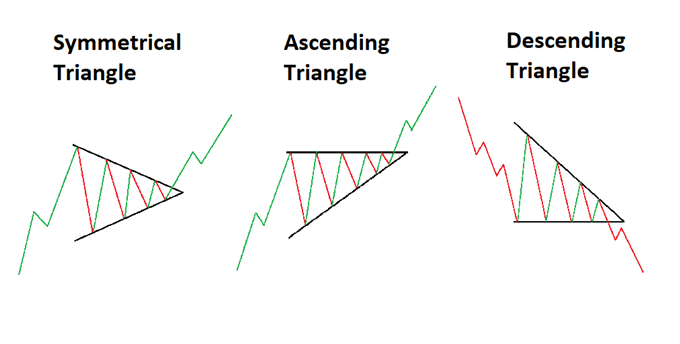
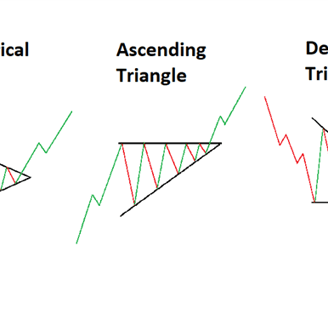
There are three main types of triangle patterns:
Symmetrical Triangle: Characterized by lower highs and rising swing lows, indicating indecision. It forms a symmetrical shape, signaling potential for a breakout in either direction.
Ascending Triangle: Features a horizontal resistance line with rising swing lows. It usually forms during an uptrend, suggesting a bullish breakout.
Descending Triangle: Consists of a horizontal support line and descending swing highs, signaling potential for a bearish breakout.
How to Trade Triangle Patterns
1. Breakout Strategy
The breakout strategy is the most common approach to trading triangle patterns. It aims to capitalize on price movement when it breaks out of the triangle’s confines, either above or below the trendlines.
Long Position: Enter when the price breaks above the upper trendline on strong volume, with a stop-loss below the previous low.
Short Position: Enter when the price breaks below the lower trendline, with a stop-loss above the previous high.
2. Continuation Strategy
Triangle patterns often act as continuation patterns, meaning the price typically resumes the prior trend after consolidating.
In an Uptrend: An ascending triangle signals a likely breakout above the resistance.
In a Downtrend: A descending triangle suggests a breakout below the support line.
Be Aware of False Breakouts
False breakouts occur when the price moves outside the triangle but quickly reverses direction. To reduce the risk of false breakouts:
Wait for a confirmed candlestick close beyond the trendline.
Monitor volume; strong volume typically confirms a genuine breakout.
Bottom Line
Triangle patterns are powerful tools for predicting market direction after a consolidation phase. By understanding and effectively trading these patterns, traders can enhance their potential for profit while minimizing risk.